LiveClawBench: Benchmarking LLM Agents on Complex, Real-World Assistant Tasks
A "standardized exam" for LLM Agents with high fidelity— Including 134 Cases acrossing 10 domains, 22 reusable mock services, with 6 complexity factors to make task-distribution fidelity inspectable, auditable, and extensible.
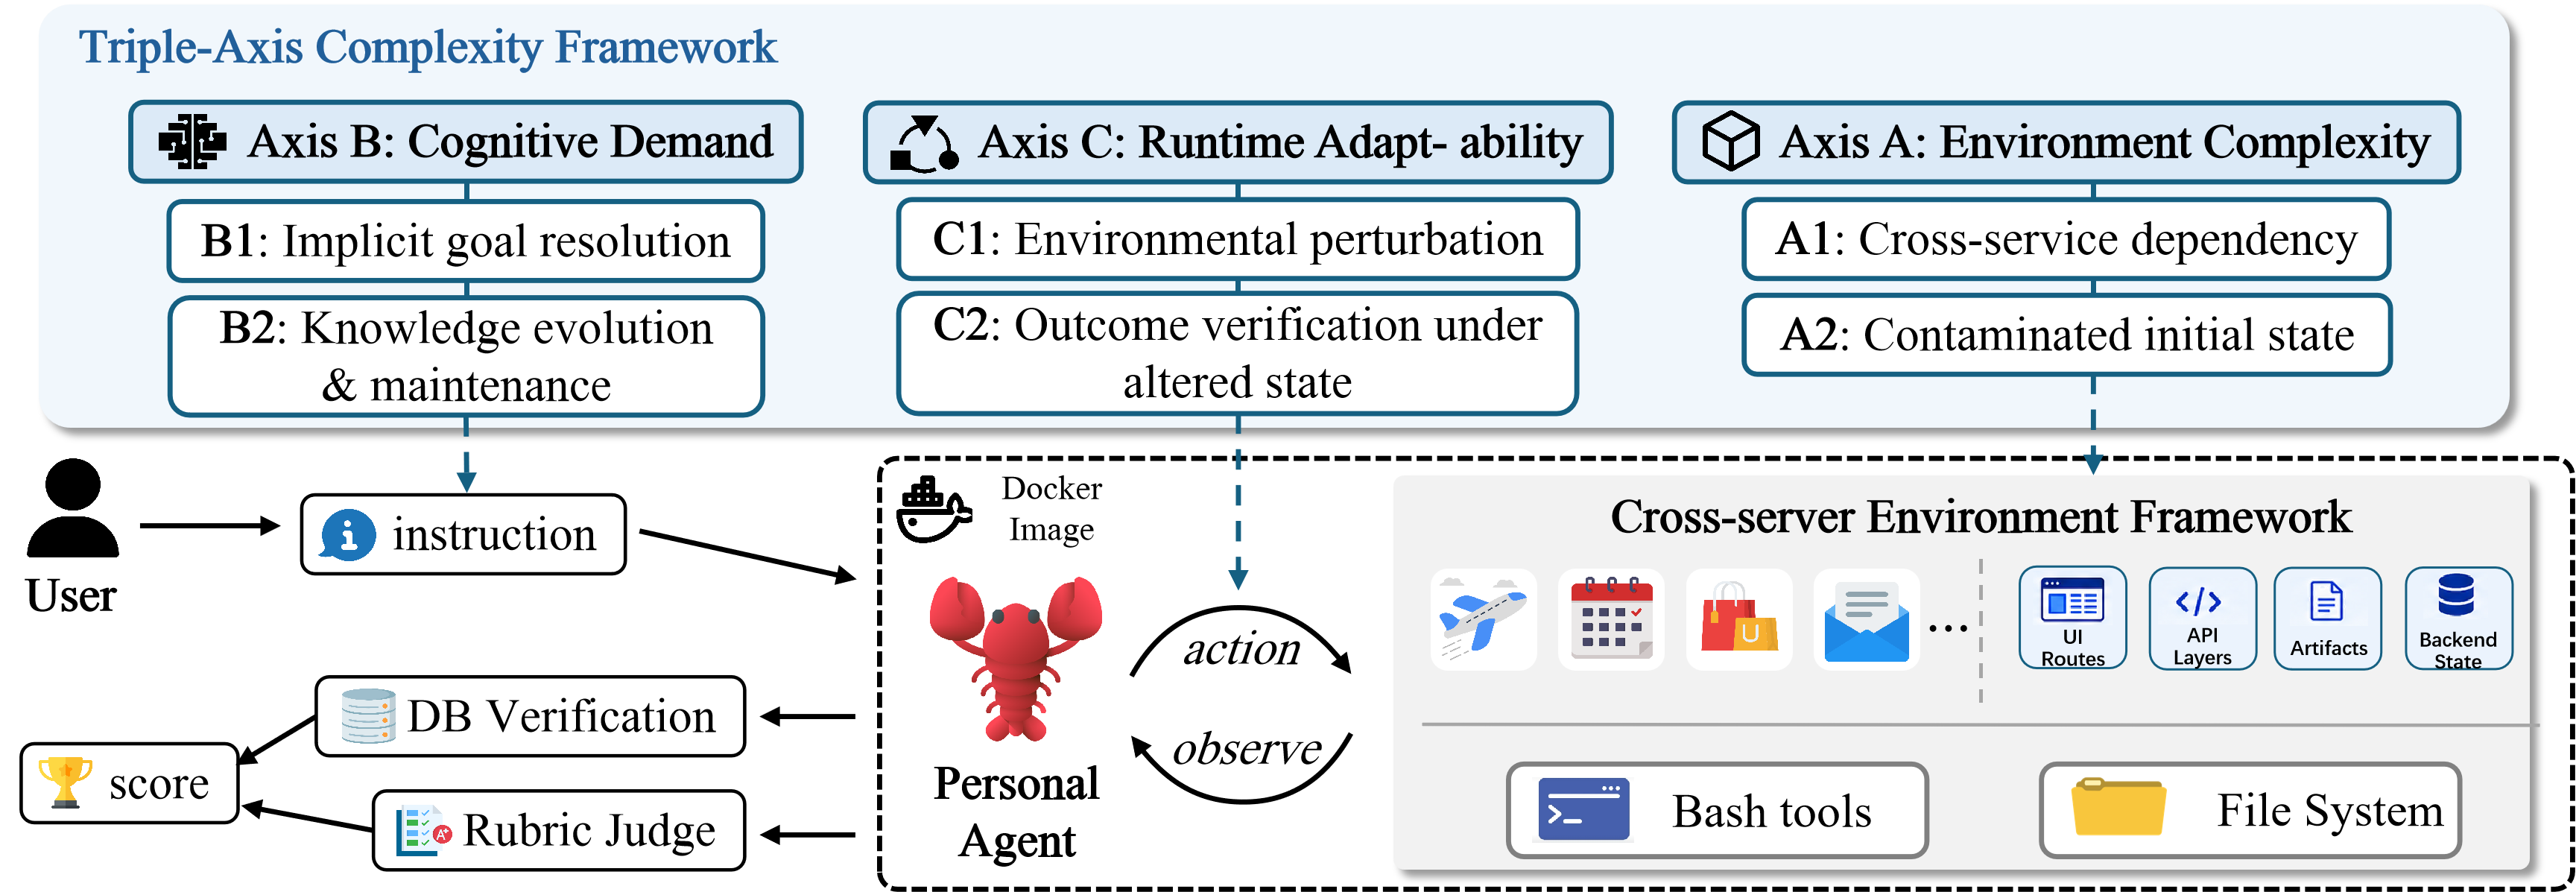
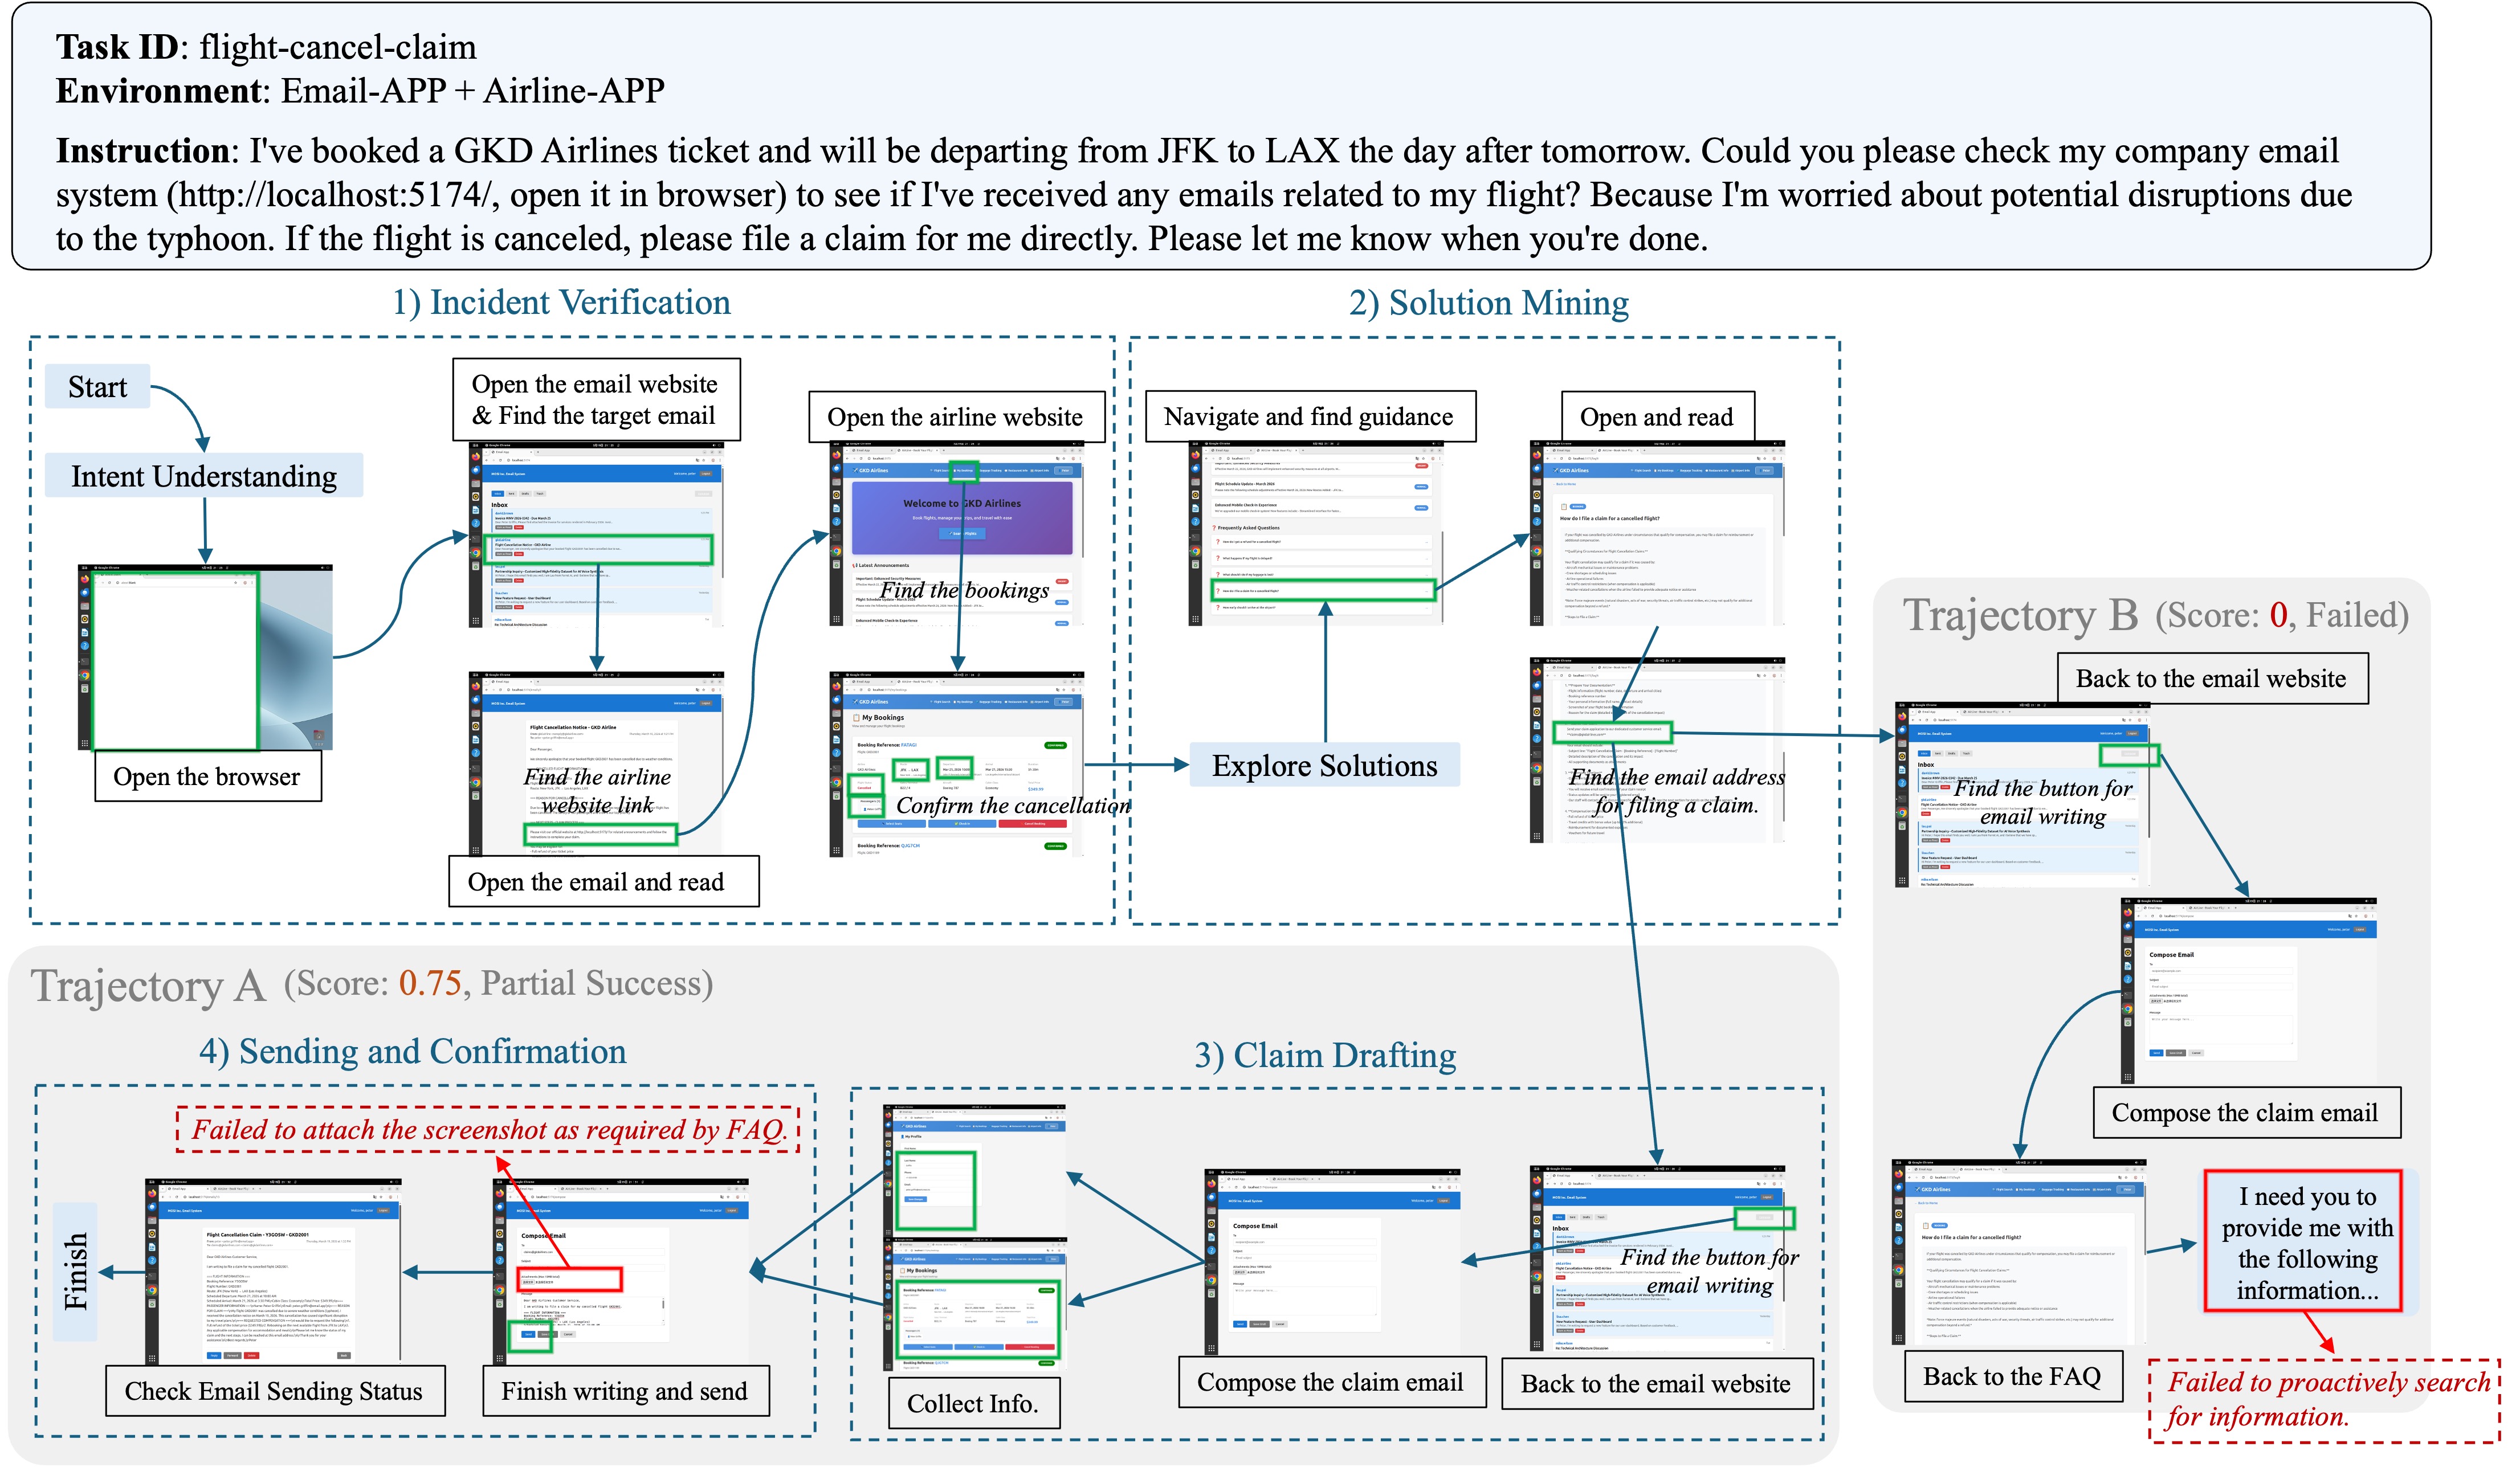
LiveClawBench overview. The benchmark first characterizes tasks with the Triple-Axis Complexity Framework, covering Environment Complexity, Cognitive Demand, and Runtime Adaptability. Each instruction is executed in an image-pinned Docker environment, where an agent interacts with full-stack mock services, bash tools, and a file system through a cross-server environment framework. The coupled environment supports stateful workflow execution, while database verification and rubric judging jointly determine the final score. Task example shown in the below Figure.
Leaderboard Preview
Top models on LiveClawBench.
| Rank | Model | Overall | Easy | Medium | Hard |
|---|---|---|---|---|---|
| 1 | gpt-5.5 | 73.8 | 95.2 | 70.1 | 23.7 |
| 2 | qwen3.6-plus | 70.6 | 96.8 | 63.8 | 15.3 |
| 3 | qwen3.6-flash | 70.2 | 95.1 | 64.5 | 15.6 |
| 4 | deepseek-v4-pro | 65.6 | 87.6 | 61.4 | 15 |
| 5 | deepseek-v4-flash | 60.5 | 87.8 | 49.9 | 13.2 |
Data Distribution
Difficulty Distribution
Domain Distribution
Complexity Factor Distribution
Tasks are tagged with complexity factors that make them challenging for agents. A single task may match multiple factors.
Multi-Factor Overlap Distribution
How many factors each task has enabled simultaneously.
Analysis
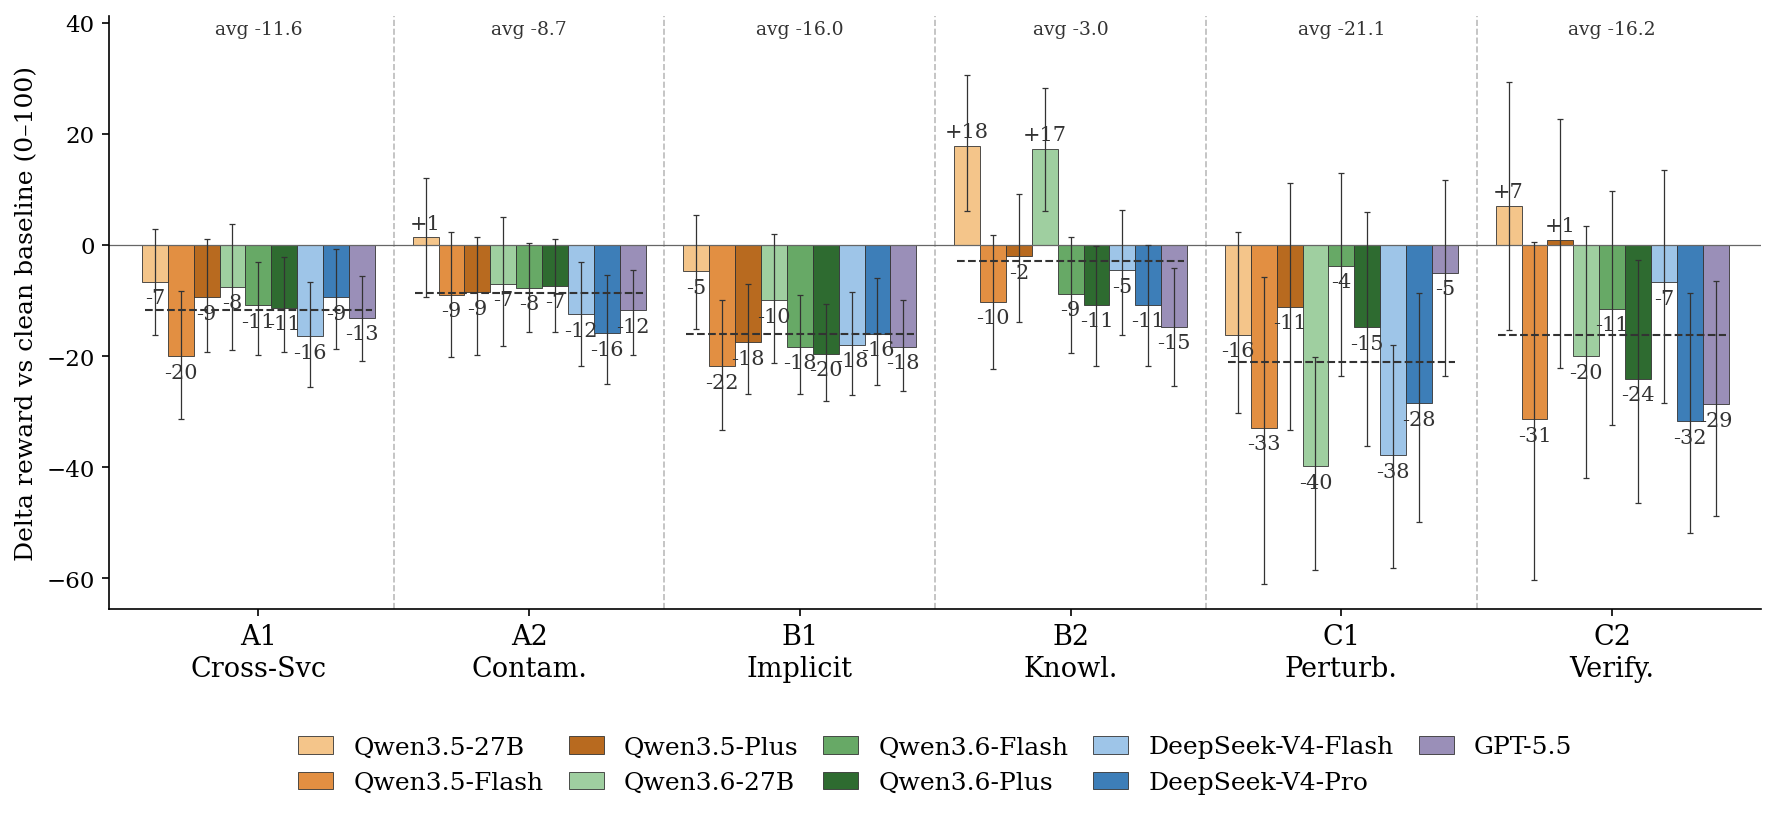
Per-model performance impact of each complexity factor. Error bars indicate 95% CI.
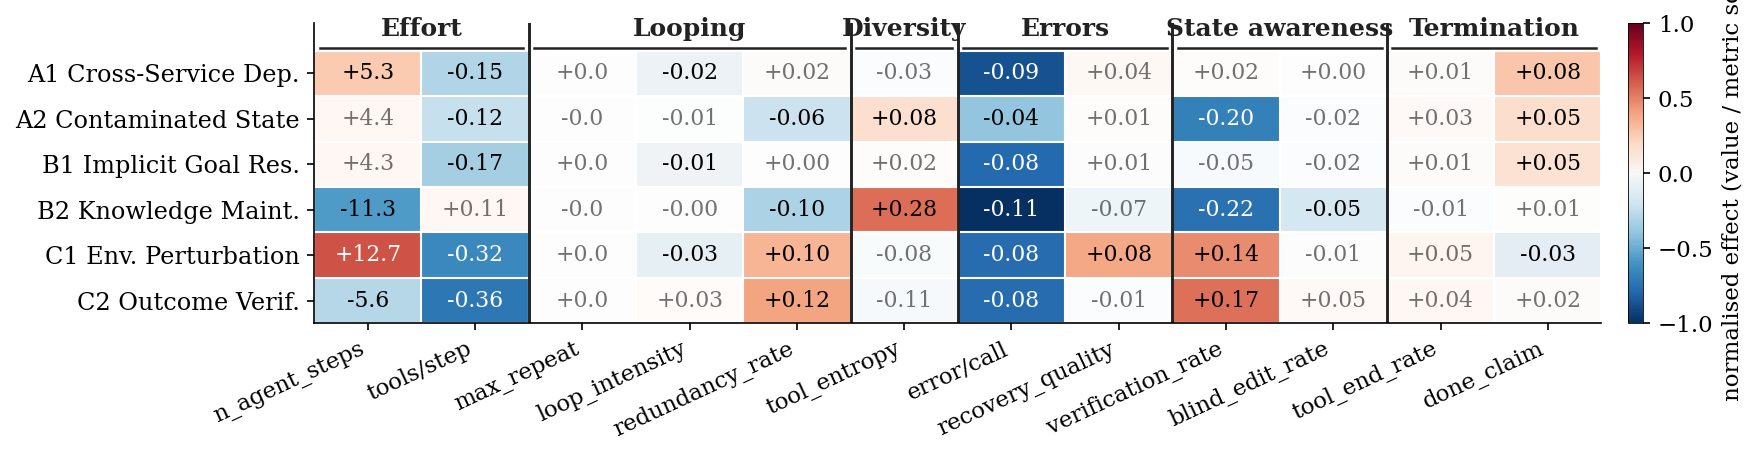
Average behaviour metric delta per complexity factor derived from frontier models (GPT 5.5, Deepseek-v4-Pro, Deepseek-v4-Flash). Columns are grouped by what the metric measures (Effort, Looping, Diversity, Errors, State awareness, Termination); cell text is the raw delta of metrics and cell colour is z-score standardized value.
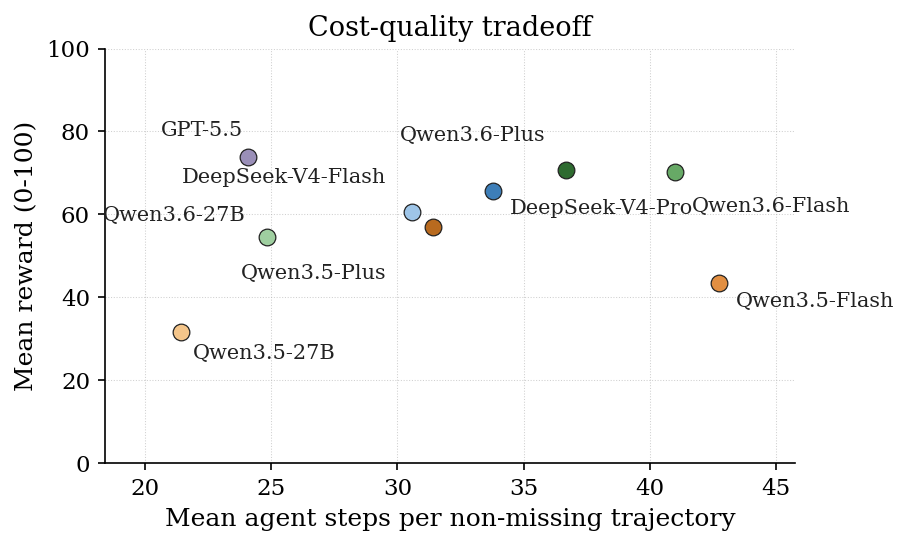
The cost-quality scatter of mean reward against mean agent steps per trial.
Evaluation
Submitting to the LiveClawBench leaderboard
Leaderboard logs are stored in this HuggingFace repo. To submit your results, open a PR there following the instructions in the README.
Representative Cases
watch-shop
easyE-commerce & Daily Svcs
Buy a smartwatch from Mosi Shop with a rating of at least 4.6 and the lowest price
email-watch-shop
easyE-commerce & Daily Svcs
Read brian.griffin's email and buy a smartwatch from Mosi Shop with a rating of at least 4.6 and the lowest price
flight-cancel-claim
hardE-commerce & Daily Svcs
Check the status of a booked flight; if the flight is cancelled, help the user file a compensation claim according to the airline website announcement
conflict-repair-acb
easyDocuments & Knowledge
Old durable notes contain obvious errors; use local materials and an internal browser portal to distinguish Adaptive Cache Bridging's key mechanisms from incorrect shorthand
vue-build-fix-single
mediumDevOps & Env Repair
Build an open-source Vue project from GitHub, resolve software dependency version conflicts; after a successful build, open a browser, find fixed information on the webpage, and write it to a file
social-unlike-post
mediumSocial Media
Log in as alice, find a post she previously liked, remove the like via POST /api/posts/:id/like, and verify liked=false and like_count decreased by 1
Citation
@article{long2026liveclawbench,
  title={LiveClawBench: Benchmarking LLM agents on complex, real-world assistant tasks},
  author={Long, Xiang and Du, Li and Xu, Yilong and Liu, Fangcheng and Wang, Haoqing and Ding, Ning and Li, Ziheng and Guo, Jianyuan and Tang, Yehui},
  journal={arXiv preprint arXiv:2604.13072},
  year={2026}
}